How to guides
Add your own data
Table of Contents
Your Data
It’s possible to add your own data to DataNation to create points, lines and/or polygons on your map. This feature is a great way to start teaching pupils simple GIS concepts and the power of creating their own datasets. You can import a simple spreadsheet with postcodes and labels or a more complex CSV file with more than two columns.
File formats
You can import datain CSV file format.
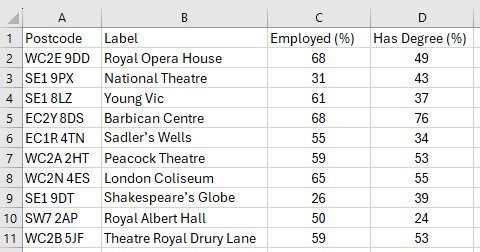
Create CSV file
- One required column containing postcodes, named Postcode in the header row.
- Other optional columns containing a label, named Label in the header row.
- We recommend limiting the number of characters in your labels for a clearer display, to say 20 characters.
- Only postcodes located in Great Britain will be recognised
For Easting/Northing:
- One required column containing Eastings, named Easting in the header row.
- One required column containing Northings, named Northing in the header row.
- One optional column containing a label, named Label in the header row.
- We recommend limiting the number of characters in your labels for a clearer display, to say 20 characters.
For British Grid References
- One required column containing grid references, named gridref in the header row.
- One optional column containing a label, named Label in the header row.
- We recommend limiting the number of characters in your labels for a clearer display, to say 20 characters.
For Latitude/Longitude:
- One required column containing Latitude in decimal format, named Latitude in the header row.
- One required column containing Longitude in decimal format, named Longitude in the header row.
- One optional column containing a label, named Label in the header row.
- We recommend limiting the number of characters in your labels for a clearer display, to say 20 characters.
Import your file
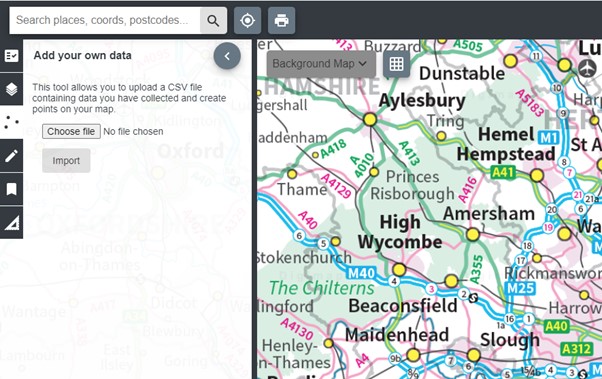
Once your CSV file is ready, open the Add your own data toll in the sidebar. Click on Chose file and navigate to the place where your file is located. Pick your file and hit Open. You will be taken back to the Add your own data tool. Click on Import.
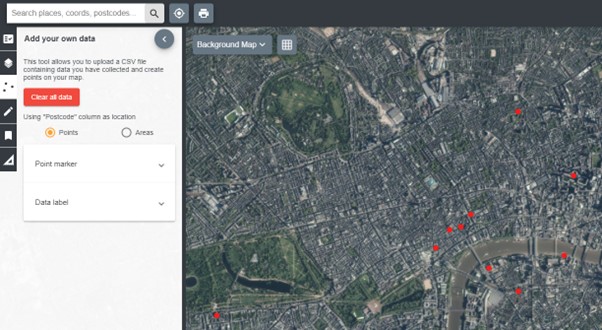
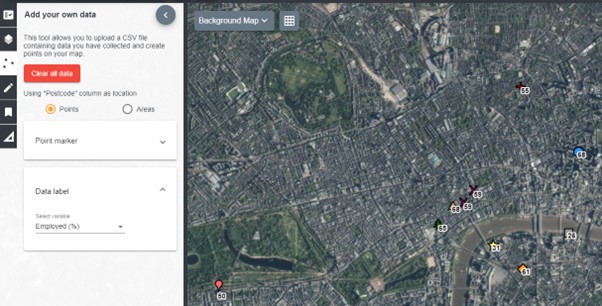
Your points should be visible on the map window. See example images below:
Editing your data
From the Add your own data tools, you can: modify the point markers and data labels individually or in groups of equal values.
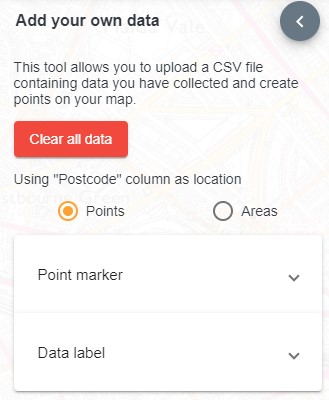
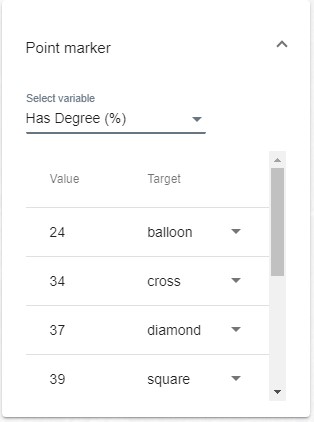
Point markers
From your CSV file, choose the data that you want to display and a different point marker to symbolise each of your individual data or group of data.
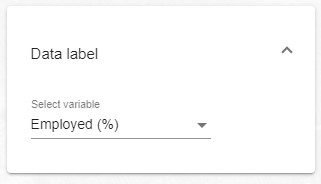
Data Label
With the data label you can display the data from your CSV file as it is. Remember to limit the number of characters in your labels for a clearer display.
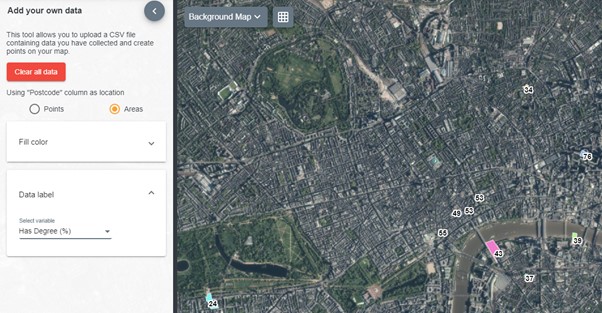
Your map will look like this:
Areas Markers
You can change the colour code of each individual marker or group of markers to suit your data model.
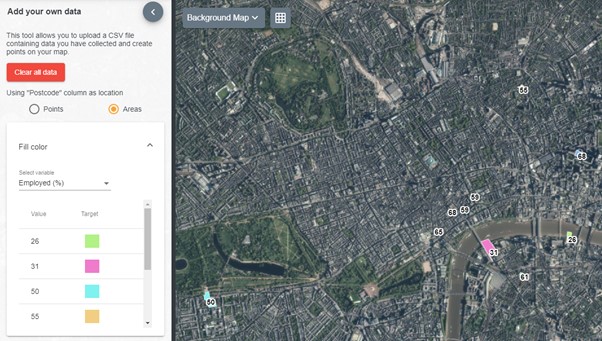
The Data label for the areas markers works in the same way as for the point markers.
